



The £50k question! I’ve watched the same scene play out in budget meetings for years. Paid media asks for another £50k and gets a nod. SEO asks for the same £50k and gets a question: “What exactly do we get back?”
This guide is my answer to that question. It’s the long version of the talk I gave at MeasureFest, the analytics track of brightonSEO, on Friday 9 October 2026. You can download the slides and my SEO Investment Forecaster spreadsheet and follow along with your own numbers.
The short version
- Build the case from five inputs: demand × capture × conversion × value × ramp.
- Turn revenue into contribution, because contribution is what finance funds.
- Never present one number. Show a downside, a base and an upside.
- Walk into the room with four numbers: the ask, the return, the payback month and the review month.
- In AI search, split demand by what the results page looks like, and give each pot its own click yield.
Why SEO budgets get stuck
Paid media gets signed off faster because it arrives with a response curve. Money goes in, a measurable response comes out, and finance can model the return: spend, response, return. Ask the ad team what another £50k buys and they can tell you, including where the curve starts to flatten.
Now look at a typical SEO pitch:
- 30 articles
- 10 links
- 1 technical audit
That’s a to-do list. It tells finance what you’ll do, but nothing about what the business gets back or when.
The fix is to give SEO the same shape as every other investment the business makes: an amount, an expected return, a payback date and a point where everyone checks the assumptions. That’s what I mean by making SEO investable.
The SEO Budget Model: Five Inputs, One Investment Case
Every SEO investment case I build now starts from the same five inputs. These are the numbers from the worked example in the talk.
| Input | Worked example | Where it comes from |
|---|---|---|
| Demand | 100,000 qualified searches a month | Search Console, Keyword Planner, paid search terms |
| Capture | +5 percentage points of incremental organic click share | Your own CTR and ranking data |
| Conversion | 3% organic conversion rate | GA4 or your CRM |
| Value | £250 average order value, at a 45% contribution margin | Finance and management accounts |
| Ramp | 10% of the opportunity in month 1, rising to 100% by month 12 | Your track record, phased monthly |
Multiply them together and you have a forecast:
Forecast = Demand × Capture × Conversion × Value × Ramp
Start with the demand that already exists. Estimate how much more of it SEO can realistically win, apply your conversion rate and customer value, then phase the return over time. That turns an SEO plan into a revenue forecast you can set directly against the cost.
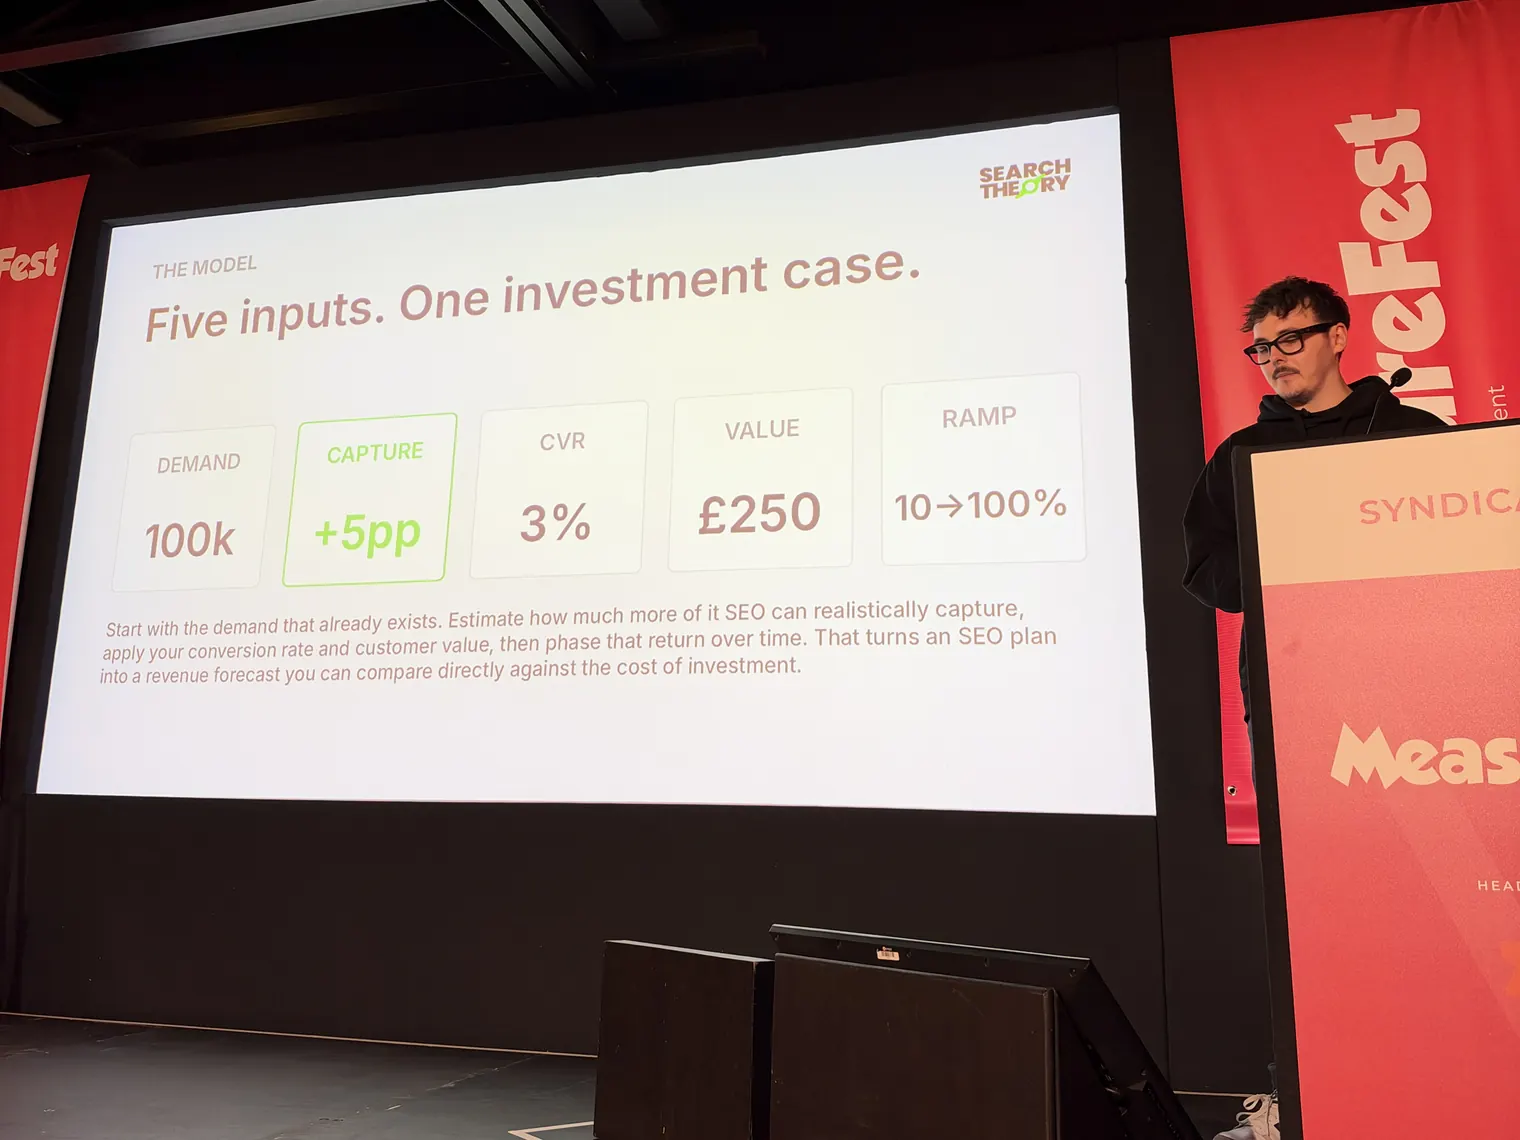
The Five SEO Budget Inputs, One By One
1. Demand: start with demand you can defend
In the example, demand is 100,000 qualified searches a month. Finance will challenge an inflated number, so only count relevant searches and build the total from sources you can show:
- Search Console impressions for topics you already appear for. This is first-party data, so it’s the hardest to argue with.
- Keyword Planner for net-new topics. Its volumes are rounded averages, so treat them as estimates.
- Your paid search terms report, which shows what people typed before they bought.
Then de-duplicate overlapping keywords, remove irrelevant demand and strip out brand. Search Console’s branded queries filter, now available to all eligible sites, makes the brand split quick. If you have a lot of Search Console history, Charles Meaden’s MeasureFest talk on the BigQuery export is the cheapest way I know to query all of it.
2. Capture: don’t forecast “position #1”
“We’ll rank first for everything” is how SEO forecasts lose credibility in the first five minutes. Instead, model the extra share of demand you think SEO can realistically capture.
In the forecaster this is two numbers: your current organic click share (3% in the example) and your target share once the work matures (8%). The difference, +5 percentage points, is the only traffic assumption in the whole model.
Base it on your own CTR curve from Search Console for comparable queries. Generic CTR curves vary with SERP layout, intent, device and brand, and AI Overviews have moved them a long way (more on that below). For a real board case, build capture up from keyword clusters rather than one big pool. The forecaster’s Opportunity Builder tab does exactly that.
Capture is also the input you’re least sure of, which is why the scenarios flex it.
3. Conversion: use your own conversion rate
The example uses a 3% organic conversion rate. Your GA4 or CRM data beats an industry benchmark every time, because finance can check it.
If you’re in lead generation, don’t value every form fill as revenue. Apply your lead-to-sale close rate from the CRM. The forecaster has a separate cell for it, set to 100% for ecommerce.
4. Value: take it through to contribution
The example uses a £250 average order value at a 45% contribution margin. Finance cares about profit, cash and payback, so the model has to end in contribution.
Contribution margin is what’s left of each extra £1 of revenue after the direct costs of making that sale. Get it from your management accounts. Use a consistent value horizon too, either first order or first 12 months, and say which.
5. Ramp: SEO has a ramp, so put it in the model
SEO doesn’t switch on like a campaign. Pages need crawling and indexing, links take time to land, and rankings settle over weeks and months.
In the talk I used a ramp of 10%, 15%, 25%, 35%, 45%, 55%, 65%, 75%, 85%, 90%, 95% and 100% of the full opportunity across months 1 to 12. Add a seasonality index on top if your demand peaks. Then, as real data comes in, replace the assumed ramp with the observed one.
Worked example: £75k in, £117k of contribution out
With the inputs above, the base case returns £261k of revenue and £117k of contribution in year one. On a £75k investment, that’s a 56% net ROI with payback in month 10.
At full run-rate, the maths is simple:
- 100,000 searches × 5 percentage points = 5,000 extra organic clicks a month.
- 5,000 clicks × 3% conversion = 150 extra orders a month.
- 150 orders × £250 = £37,500 of extra revenue a month.
- £37,500 × 45% margin = £16,875 of extra contribution a month.
You don’t get full run-rate from day one, though. Add up the ramp across 12 months and you get 6.95 “full months” of value. So year one is £37,500 × 6.95 = £260,625 of revenue, which rounds to the £261k on the slide.
Turn revenue into economics
£261k of revenue is not £261k of value. At a 45% contribution margin, only 45p of every extra £1 is left to cover overhead and profit after the direct cost of the sale. So £260,625 of revenue becomes £117,281 of contribution.
Set that against the £75k investment, paid at £6,250 a month:
- Net ROI on contribution: (£117,281 − £75,000) ÷ £75,000 = 56%.
- Payback: month 10, when cumulative contribution passes the full £75k year-one budget.
- Cash-flow breakeven: month 8, when cumulative contribution overtakes cumulative spend to date.
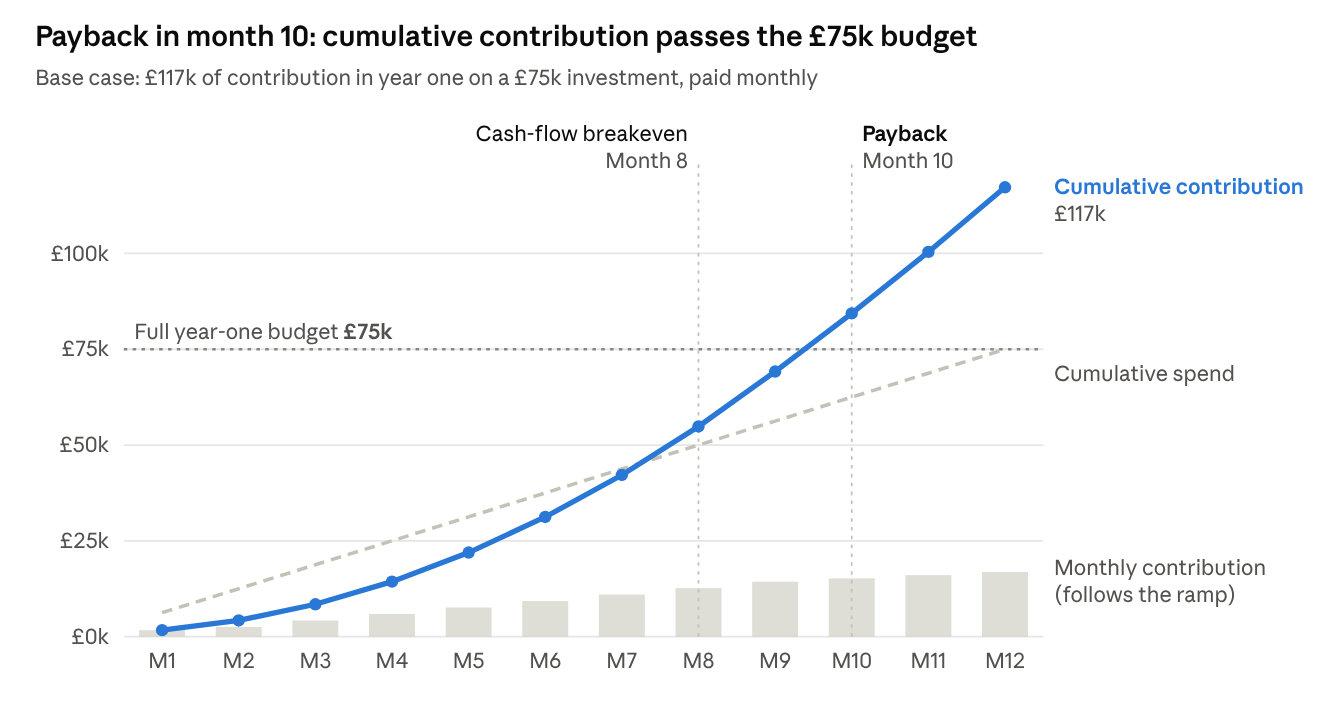
The grey bars are the ramp at work. Contribution stays small for the first few months, which is exactly why finance needs to see it planned rather than discover it.
If you’re following along in the forecaster, one note. It ships with a straight-line ramp that hits 100% by month 10, so its default outputs are a little higher: £281,250 of revenue, £126,563 of contribution, 69% ROI and payback in month 9. Paste in the ramp above to reproduce the talk’s numbers, then replace everything with your own data.
Never present one number
Give finance one number and the meeting turns into an argument about that number. Three scenarios turn it into a conversation about assumptions, which is the conversation you want.
In the talk I flexed capture, because it’s the input you’re least sure of, and held everything else at base:
| Scenario | Extra click share | Year-one revenue | Year-one contribution | Net ROI | Payback |
|---|---|---|---|---|---|
| Downside | +2.5pp | £130k | £59k | −22% | Not in year one |
| Base | +5pp | £261k | £117k | +56% | Month 10 |
| Upside | +8pp | £417k | £188k | +150% | Month 8 |
The downside row matters most. It shows finance that the worst case falls about £16k short of breaking even in year one, while still leaving rankings and content that keep working into year two. That’s far more persuasive than pretending there is no worst case.
The forecaster’s Scenarios tab lets you flex conversion rate, order value and margin as well. And if someone disputes the forecast in the room, ask which assumption they disagree with, then change it live.
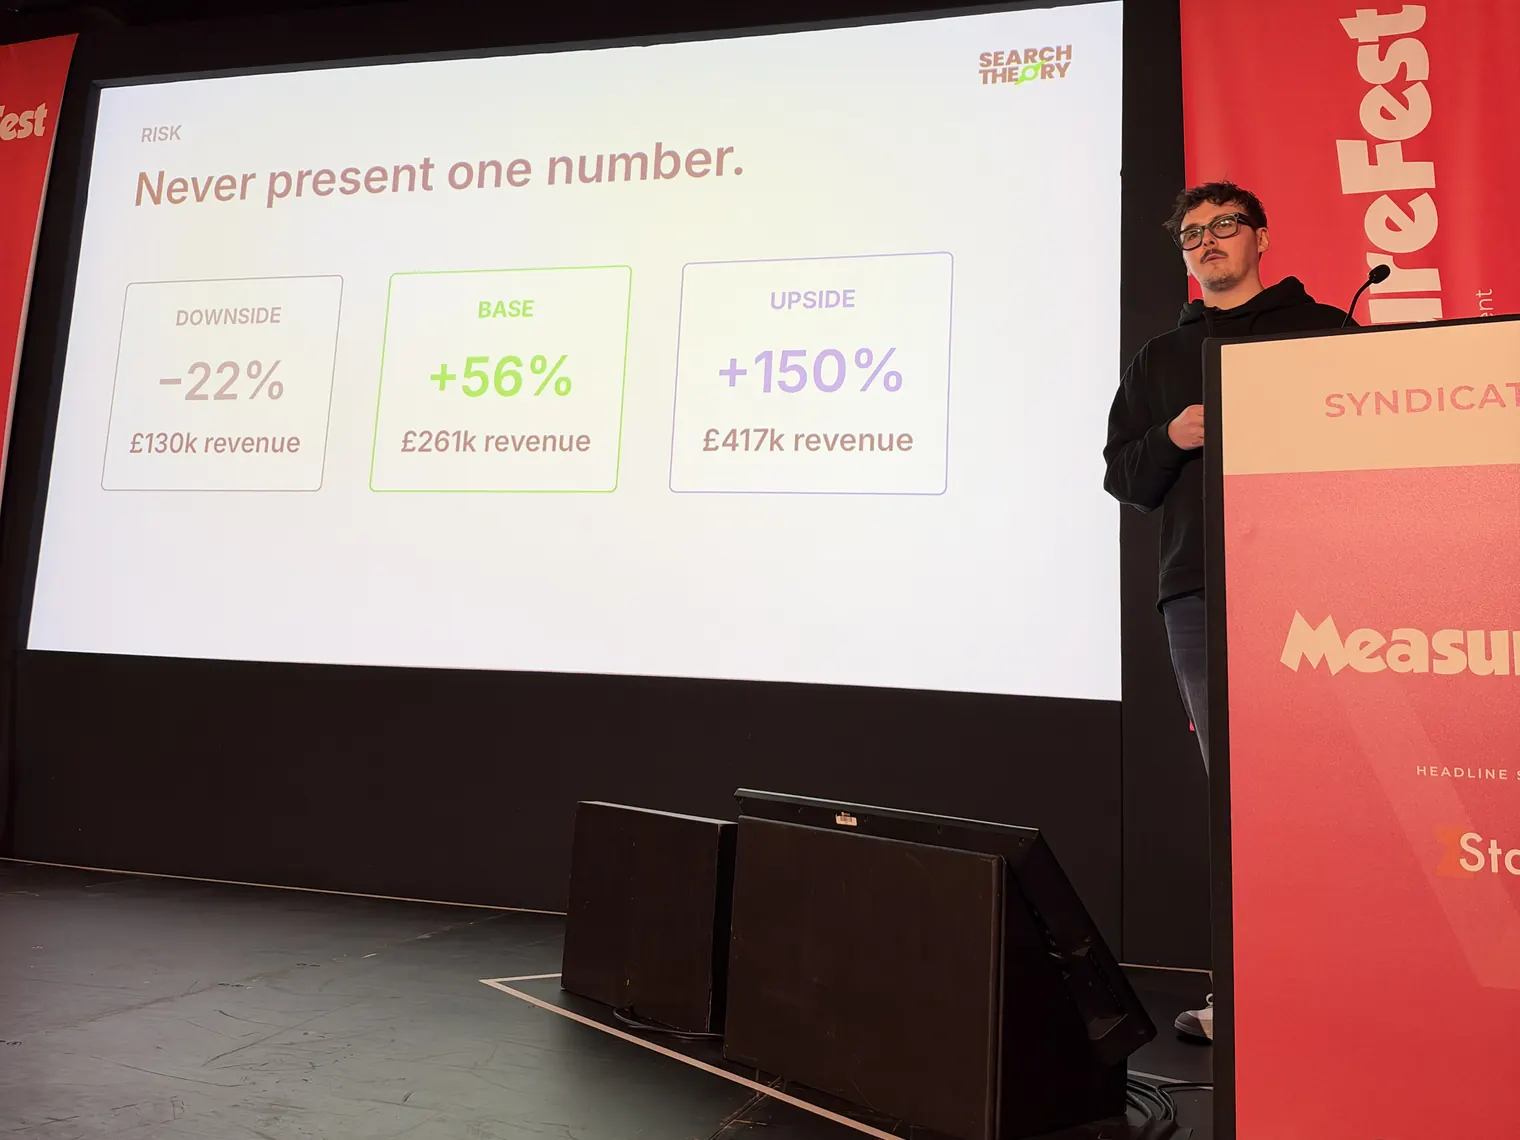
The boardroom slide: give them four numbers
Everything else belongs underneath the model. On the slide, there are four numbers:
| Ask | Return | Payback | Review |
|---|---|---|---|
| £75k | £117k of contribution | Month 10 | Month 6 |
Then say it out loud:
“We are asking for £75k. Our base case returns £117k of contribution in year one. Payback is month 10. We review the model at month 6.”
The review month is the number most SEO pitches leave out, and in my experience it’s the one that gets budgets signed. It tells finance you aren’t asking for blind faith.
At month 6 you compare actuals against the ramp. In the example, month 6 should be delivering around 2,750 extra organic clicks a month (55% of 5,000), with £37,500 spent so far. If you’re well short, you change the plan or stop, before the money has gone.
A forecast like this is an underwriting model, and every assumption in it can be challenged, changed and reviewed. That’s why my closing slide read: “Do not try to make SEO certain. Make the uncertainty investable.”
How to Forecast SEO With AI Overviews, AI Mode and AI Assistants
At MeasureFest someone asked how this model holds up now that AI Overviews sit above the results. My honest answer on the day was thin: put AI Overview searches in their own pot and forecast them separately. The instinct was right, but it isn’t a method. This is the answer I wish I’d given.
The data so far (October 2026)
- In a randomised field experiment with 1,065 US desktop users in January and February 2026, Agarwal and Sen found organic clicks per search fell 39.8% when an AI Overview appeared (0.37 against 0.62), while paid clicks didn’t move.
- Ahrefs found position-one CTR was about 58% lower than expected on keywords with an AI Overview, across 300,000 keywords from December 2023 to December 2025.
- Being cited helps. Seer Interactive (53 brands, 2.43bn impressions) found informational queries earned about 33,500 clicks per million impressions with no AI Overview, 20,743 when the brand was cited in it and 9,445 when it wasn’t.
- AI Overviews are spreading into commercial queries: Semrush saw them grow 71% on commercial-intent results between November 2025 and April 2026, while transactional results fell 5%.
- In the UK, around 30% of searches show one, according to Ofcom.
- AI Mode is harder to call. Google says it has over a billion monthly users (I/O, May 2026), yet SparkToro and Similarweb data suggest only 0.34% of US searches moved into it between January and April 2026. When people do use it, clicks drop sharply: a preregistered experiment by Wang and colleagues found AI Mode cut click-through by 18.8 percentage points.
- AI assistants send real but small traffic. Across 101,574 sites, SE Ranking found AI platforms sent 0.32% of all traffic in early 2026, and 0.16% in the UK, against 42.75% from organic search.
The model still works with AI Overviews in the picture. What has to change is capture, which can no longer be a single number.
The AI-aware version of the model
The five inputs stay the same. The difference is that you split demand by what the results page looks like, and give each pot its own click yield.
- Split demand into SERP states. Tag each keyword cluster as one of three: no AI Overview, AI Overview that cites you, or AI Overview that doesn’t. Most rank trackers now record AI Overview presence and citations. Search Console’s new Generative AI performance report shows the impressions your pages earn in AI Overviews and AI Mode, although it has no click data.
- Give each state a click-yield factor. Best of all is your own Search Console CTR for comparable queries in each state. If you don’t have that data yet, Seer’s figures imply a cited AI Overview yields about 62% of the clicks of a clean results page, and an uncited one about 28%. Multiply the capture uplift in each pot by its factor.
- Don’t double count. If your current and target click share already come from recent Search Console data on AI Overview queries, the haircut is baked in. Only apply factors to benchmarks, generic CTR curves or older data.
- Add SERP drift to the downside. AI Overviews are spreading into commercial queries, so assume part of today’s clean demand gains one during the forecast year.
- Treat AI Mode as downside leakage. Its share of searches is still small and clicks out of it are rare. Model it as extra demand loss in the downside, and revisit it at every review.
- Give AI assistants their own line, as upside. GA4 added an AI Assistant default channel in May 2026, covering ChatGPT, Gemini and Claude. Size the line from your own data. Conversion evidence is mixed: one study of 973 ecommerce sites found organic converting about 13% better than ChatGPT, another of 94 brands found ChatGPT converting 31% better than non-branded organic. Assume parity until you have six months of your own numbers.
- Report AI visibility as a leading indicator. Track how often you’re cited across a fixed set of prompts, run repeatedly, because AI answers vary from run to run. Bring it to the month-6 review rather than the ROI line.
- Clean your baseline. Google confirmed a Search Console logging error that overstated impressions from 13 May 2025 to 27 April 2026, and the history wasn’t corrected. Clicks were unaffected. For CTR baselines, use data from after 27 April 2026, or lean on clicks.
The worked example, AI-adjusted
Say 40% of the 100,000 searches trigger an AI Overview, which sits between Ofcom’s UK estimate and the 41% Agarwal and Sen observed. The 60,000 clean searches keep the full +5pp uplift. The 40,000 AI Overview searches get the same uplift, multiplied by their yield factor. Everything else stays as it was in the talk.
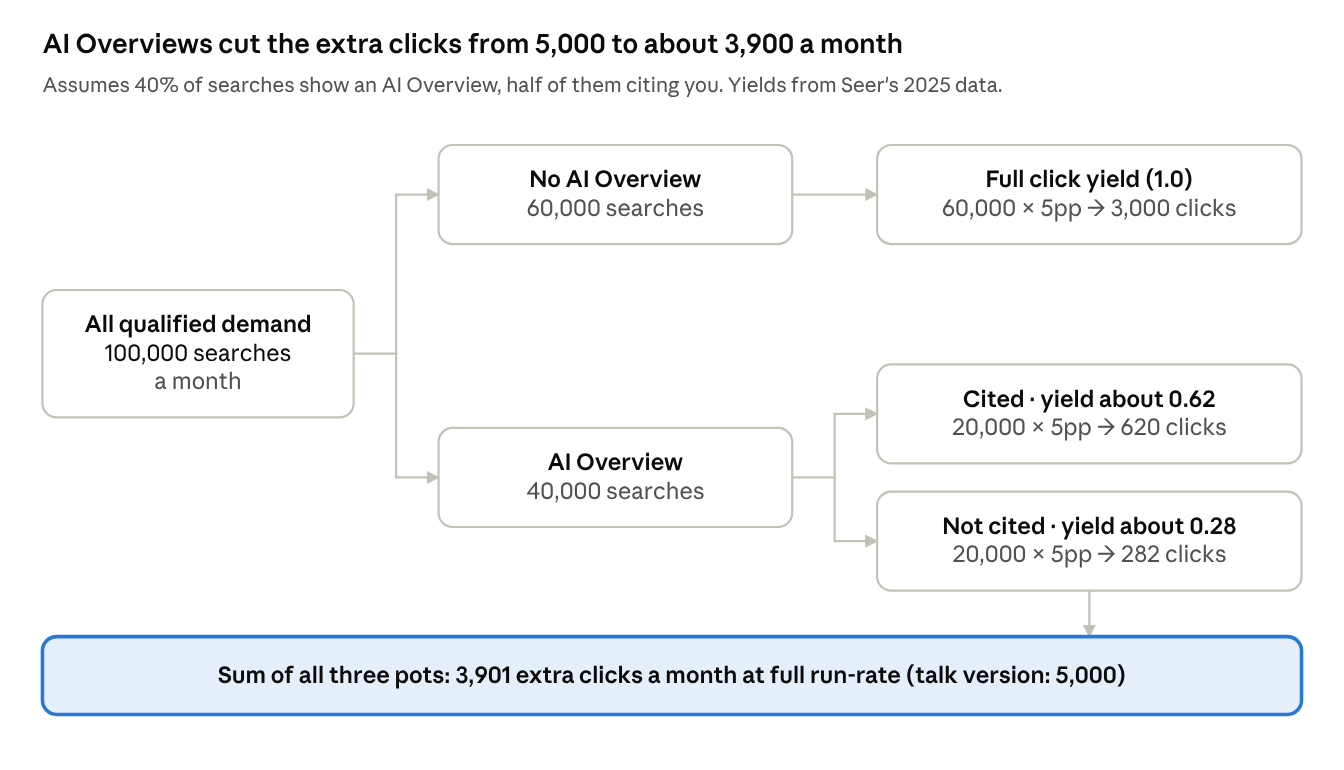
The clean pot keeps the full uplift. The AI Overview pot still adds clicks, but fewer, and being cited roughly doubles what it adds.
| Scenario | Assumption | Extra clicks a month at full run-rate | Year-one revenue | Year-one contribution | Net ROI | Payback |
|---|---|---|---|---|---|---|
| Talk version | No AI split, +5pp everywhere | 5,000 | £261k | £117k | +56% | Month 10 |
| AI-adjusted downside | 55% of demand has an AI Overview, cited in a quarter | 3,257 | £170k | £76k | +2% | Month 12 |
| AI-adjusted base | 40% has an AI Overview, cited in half | 3,901 | £203k | £92k | +22% | Month 11 |
| AI-adjusted upside | 40% has an AI Overview, cited in all | 4,238 | £221k | £99k | +33% | Month 11 |
The AI-adjusted case is smaller. It’s also more honest, and it survives the first question any finance director will ask in 2026: “What about AI Overviews?”
It also shows where the upside lives. In this example, going from uncited to cited across the whole AI Overview pot is worth about £16k of contribution a year. That gives you a commercial case for digital PR and content designed to be cited, in numbers finance already understands.
Download the slides and the forecaster
Everything from the talk is free on our MeasureFest page, with no form to fill in:
- The SEO Investment Forecaster (Excel). A 12-month model: enter demand, current and target click share, conversion rate, order value, margin and ramp, and it returns contribution, net ROI, payback month and downside, base and upside scenarios. It opens in Excel, Google Sheets or Numbers. Start on the Start Here tab and only edit the green cells.
- The slides (PDF). The full deck, including the worked example and the boardroom slide.
If you’d like a second pair of eyes on your investment case before it goes to finance, get in touch with us at Search Theory®.